THE TRUTH ABOUT MAN-MADE (ANTHROPOGENIC) GLOBAL WARMING (ALSO CALLED "AGW")
|
Foreword Inexpensive, reliable energy is the foundation-stone of any successful and prosperous modern economy The major motivation for going to the considerable effort of creating this web-page is revealed in this graph concerning the cost of electrical energy to consumers in Australia.
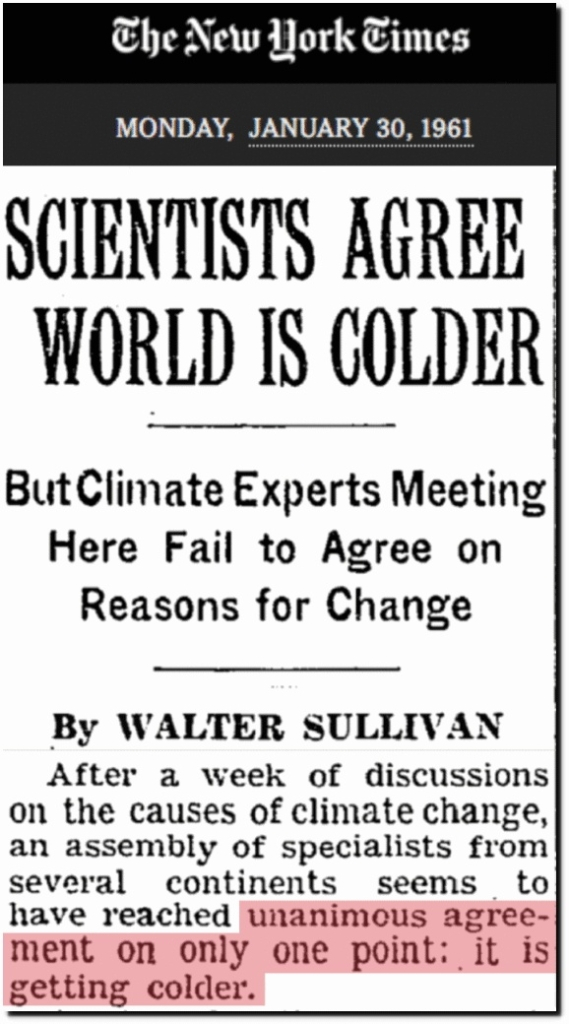
Since the introduction of "Renewables", the Cost of Electricity has risen almost 6 times the CPI! Advocates of "renewable" energy claim that once renewable energy systems are fully established, renewable energy will be cheaper than coal fired or nuclear power. This is wrong. To learn why this is so, please click here to read a paper that does a rough scoping study of a proposed 8 Gigawatt renewable energy system supported by pumped hydro which is being proposed by the NSW Government. The end result of this analysis is that electricity produced under this scheme is likely to cost more than twice that produced by coal fired power stations. So why have most Western economies been subjected to these costs? The answer is that there is the false belief that the earth's atmosphere is warming and that this warming is due to an increasing concentration of Carbon Dioxide in the atmosphere. In actuality, as will be shown here, raw, unadjusted land temperature data shows that the earth's atmosphere is, in fact, cooling! It is not warming! That was the consensus of scientists in 1961 before it became trendy to be a climate change alarmist. In addition to that, any further increase in the concentration of carbon dioxide in the earth's atmosphere will not make any appreciable difference to the earth's global temperature because those narrow bands of the IR spectrum that are absorbed by carbon dioxide are already being fully absorbed by the existing concentration. Additional carbon dioxide will not make it worse. Indeed, as explained in the following, the increased carbon dioxide in the earth's atmosphere has had numerous beneficial effects. It is doing no harm. |
|||||||||||||||||||||||||||||||||||||||||
|
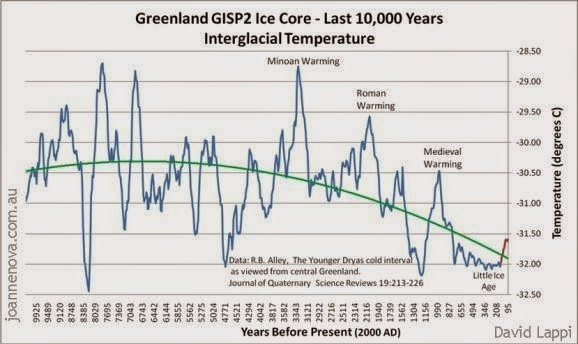
It's Cooling Not Warming Mankind should be concerned about the coming global cooling, not global warming. Should that happen, there is a possibility of long-term drought in the Southern Hemisphere, global crop failure, widespread famine, mass illegal migration and a collapse of Western civilisation. This graph shows that for the past 10,000 years the earth has been steadily cooling in fits and starts. Note that, in the past, there have been much greater variations in temperature than have been experienced in recent times. In 1961, there was unanimous consensus for global cooling. Somehow between then and now, the temperature data for over 100 years has been revised such that the past was made cooler and the present was made warmer. Below are displayed graphs of raw data recorded from temperature monitoring networks around the world. They all show the same cooling trend. For all of these networks, operated over very long periods of time by persons who did not collaborate, nor even communicate with each other, to be erroneous is just not plausible. The raw data, before it has been adjusted by those who are selling the narrative the earth's atmosphere is warming and that this warming is the result of increasing concentrations of CO2, shows a distinct cooling trend, in fits and starts, over the last 100 years. In recent times, the hottest period seems to be around the 1930s. |
|||||||||||||||||||||||||||||||||||||||||
|
Actual raw (unadjusted) data collected from opposite sides of the planet The following graphs are derived from raw, unadjusted data. (My sincere thanks to Mr Tony Heller.) This is significant. These archives represent temperature readings taken by numerous groups of people over, in some cases,a period of greater than a hundred years, working in isolation. Some groups in the Northern Hemisphere and some in the Southern Hemisphere. |
|||||||||||||||||||||||||||||||||||||||||
Here is the trend (as reported by all US-controlled weather stations) over the last 100 years 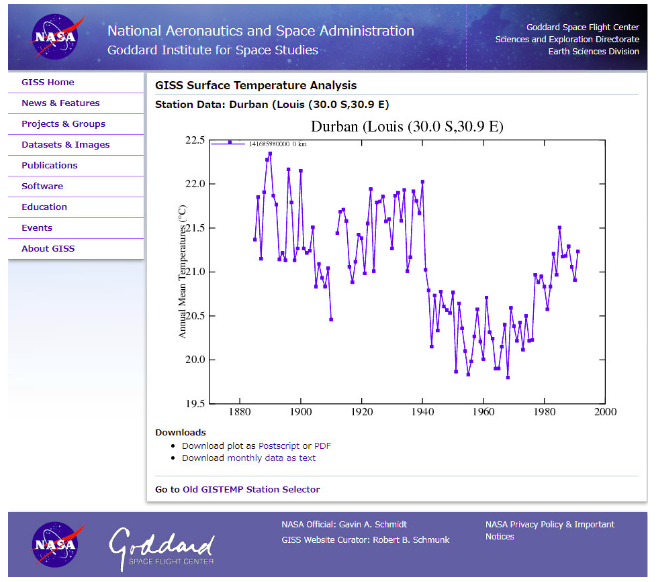
Here is the same trend over the last 100 years in Durban Sth Africa (1885-1995) 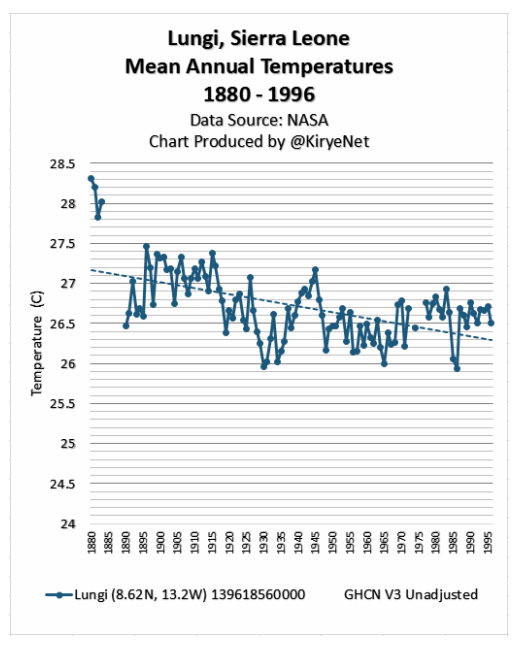
Here is the trend for Sierra Leone (1885-1995) 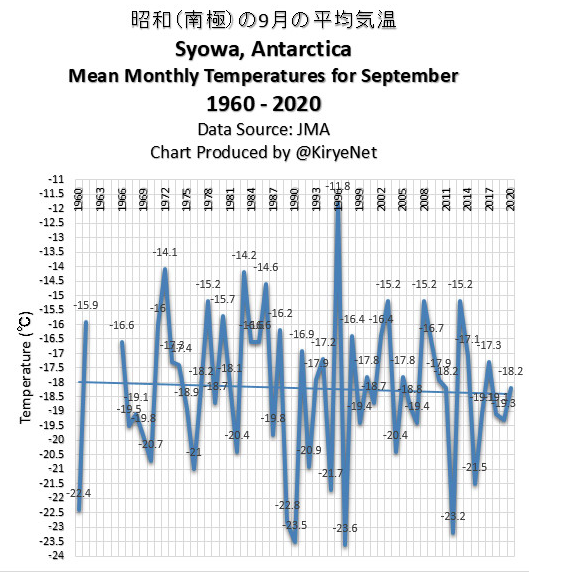
Here is the trend for Syowa Antactica (1960-2020) 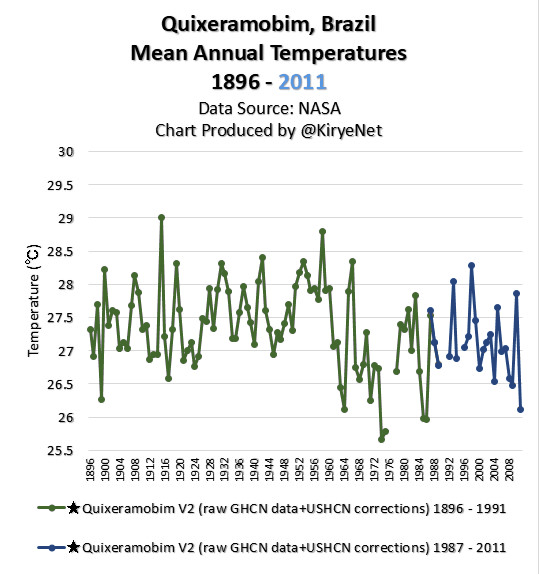
Here is the trend for Quixeramobim Brazil (1896-2009) 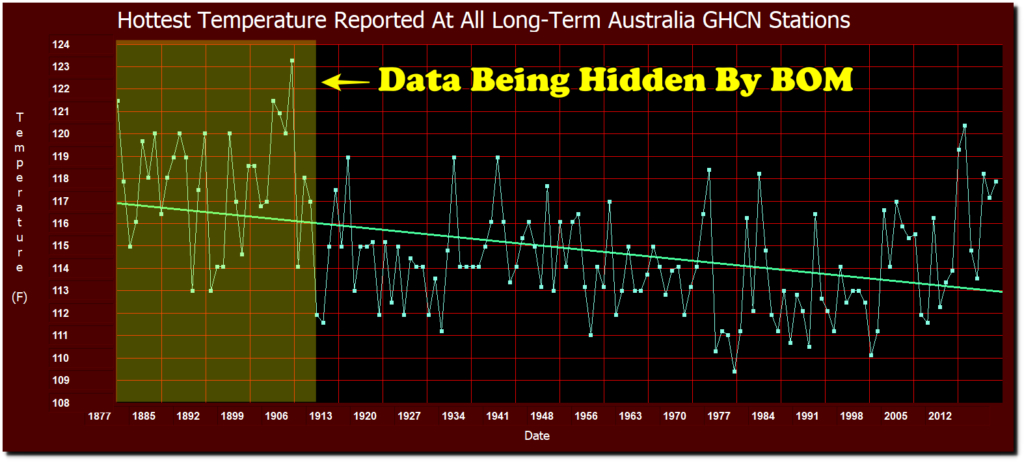
Here is the same trend over the last 100 years in Australia (1877-2016) |
|||||||||||||||||||||||||||||||||||||||||
|
All of these plots have one common thread, a downwards trend in temperature. However, you will note that the Australian trend only starts to diverge from the US trend in the last 15 or so years since the Australian Bureau of Meteorology started to fiddle with the raw data, and the methods/equipment used to collect the raw data, to fit the global warming narrative espoused by Jim Hansen to a US Congressional hearing in 1988. It should be noted that the data presented in the US and Australian temperature graphs, up until recently, is the result of two groups, comprised of thousands of public servants, making tens of thousands of temperature measurements over a period longer than 100 years without any opportunity for those two groups to collude. The data they recorded, one group in the Northern Hemisphere and one in the Southern Hemisphere, almost perfectly on the other side of the planet to each other, records the same trend. The same comment applies to the other plots. The temperatures are falling and have been doing so in fits and starts for over the last 100+ years. The chance of these independently operating groups getting the data wrong is infinitesimally small. |
|||||||||||||||||||||||||||||||||||||||||
|
The Evidence supporting the Contention there has been Deliberate Fraud - The planet is cooling... not warming. One can only conclude that this data is accurate. If that is indeed the case, one can only conclude that there has been widespread fraud and/or incompetence on the part of Government agencies the taxpayers and our political representatives should have been able to trust. This fraud has consisted of systematically altering past archival data over a number of years in carefully stage manipulations. As a primer to learn how this was carried out, I urge you to look at the following excellent presentation, by Mr Tony Heller, someone whose integrity and technical knowledge I admire. For a more detailed explanation of the level of fraud that has been perpetrated by Government agencies, aided and abetted by other organisations and agencies with an interest in promoting the pseudo-science that is AGW, plus how they have done this, you need to watch(These presentations go into far more detail than the earlier one I alluded to above.): "A Very High Probability Of Fraud By Government Climate Scientists", by Tony Heller.A Government climate report which was leaked to the New York Times, was loaded with misinformation, manipulated data, bad mathematics, junk science and fraud. If that grabs your interest then there is a series of 4 videos that further elaborate on the scale of this fraud and what is driving it. "Fraud In The National Climate Assessment (Part 1)", by Tony Heller.This is the first of a series of videos exposing the dishonest practices of the government scientists who wrote the 2018 National Climate Assessment. They have an agenda, and the agenda has nothing to do with informing the public about climate. "Fraud In The National Climate Assessment (Part 2)", by Tony Heller.The National Climate Assessment contains sea ice graph information designed to mislead readers. This video details how this is so. "Fraud In The National Climate Assessment (Part 3)", by Tony Heller.You might say, "How could this be? This can't be true!" Then you need to watch: "The Climate Industrial Complex", by Tony HellerThis video deals with what Heller calls "the climate industrial complex" and how it has manipulated data so as to give itself a lucrative income at the expense of taxpayers and consumers of energy worldwide. The Fraud of the 97% Consensus 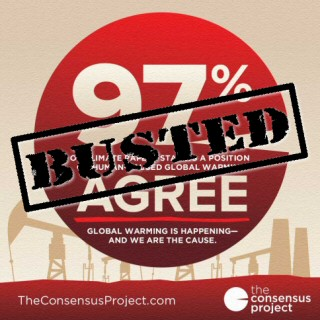
97% Consensus - Busted as Fraudlent! You may have heard that the majority of climate scientists agree with AGW. That is absolutely untrue. If you want to learn about how fraudulent the process was that came to that lie, you need to watch: "97% Fraud!", by Lord Christopher Monkton.You can also read: The Stunning Statistical Fraud Behind The Global Warming Scare ExaminingTemperatureRecordingFraudor Mark Steyn's Book, "A Disgrace to the Profession" Page 295 describes a survey by Margaret Zimmermann a master of science student at the University of Illinois, in 2008, sent out an on-line Questionnaire to 10250 earth scientists. Of those, 3146 responded. Of those, around 50% did not support an opinion on Global Warming as a consequence of mankind's CO2 output.So Zimmermann selected 79 of the 3,146 that responded and posed another question. Of which 75 scientists gaave her an answer that was acceptable to her. From that she derived the figure 97.4% of climate scientists agree. John Cook, an Australian "researcher" is also similarly guilty of such dubious practices to reach a similar flawed conclusion. Indeed, real scientists were so incensed by this fraud that they started what was called "The Global Warming Petition Project" In that, 31,487 American scientists, including 9,029 with PhDs, have signed this petition stating that: "There is no convincing scientific evidence that human release of carbon dioxide, methane, or other greenhouse gases is causing or will, in the foreseeable future, cause catastrophic heating of the Earth's atmosphere and disruption of the Earth's climate. Moreover, there is substantial scientific evidence that increases in atmospheric carbon dioxide produce many beneficial effects upon the natural plant and animal environments of the Earth." For further evidence as to the authenticity of this petition go to Global Warming; 31,487 Scientists say NO to Alarm So how is it that some scientists are actually promoting this fraud? Well the answer might be found here: "Scientists Have been Bought!", by climatologist Roy Spencer - The Bias in Climate ScienceIn this video Dr Roy Spencer, a person who once worked for NASA (and who is mentioned in glowing terms in the previous video, "Scientists say NO to alarm"), describes how scientists have prostituted their integrity in order to have a safe, secure job.In recent times, we have seen the unfair dismissal of Professor Peter Ridd from the James Cook University because he expressed concern about the rigour of peer review and the accuracy of data presented in papers produced at the university. The university benefits greatly from Government grants to investigate a problem that Professor Ridd suggests may not exist or, at the very least, is exaggerated! As mentioned at the beginning of this paper, the earth has been cooling for 10,000 years. The graph at the start of this blog, (The big picture: 65 million years of temperature swings) shows that the earth has been steadily cooling in fits and starts for the last 10,000 years. When viewed over that timeframe, the recent warming period is not statistically relevant. The earth is now entering a period of global cooling not warming! |
|||||||||||||||||||||||||||||||||||||||||
|
The Sea Levels are NOT Rising at an Increasing Rate 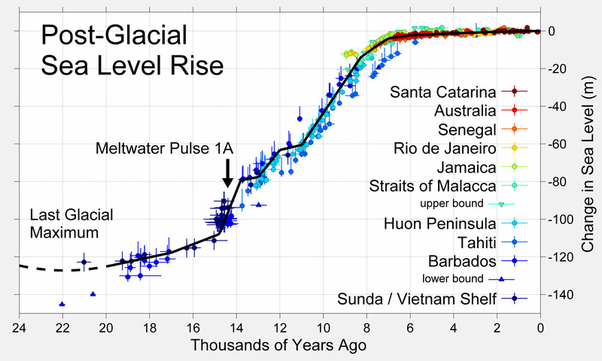
The Rate of Rise of Sea Level is Slowing Down An examination of the historical record relating to rising sea levels further reinforces the graph showing cooling at the beginning of this page. The rate of rise has actually been decelerating over the last 10,000 years. The present rate of rise is pretty much constant. Consistent with this, the graph, (left - based on data from Fleming et al. 1998, Fleming 2000, and Milne et al. 2005 - WikiMedia Commons) shows that the rate at which the sea level is rising has plateaued and is possibly even in a gradual decline. |
|||||||||||||||||||||||||||||||||||||||||
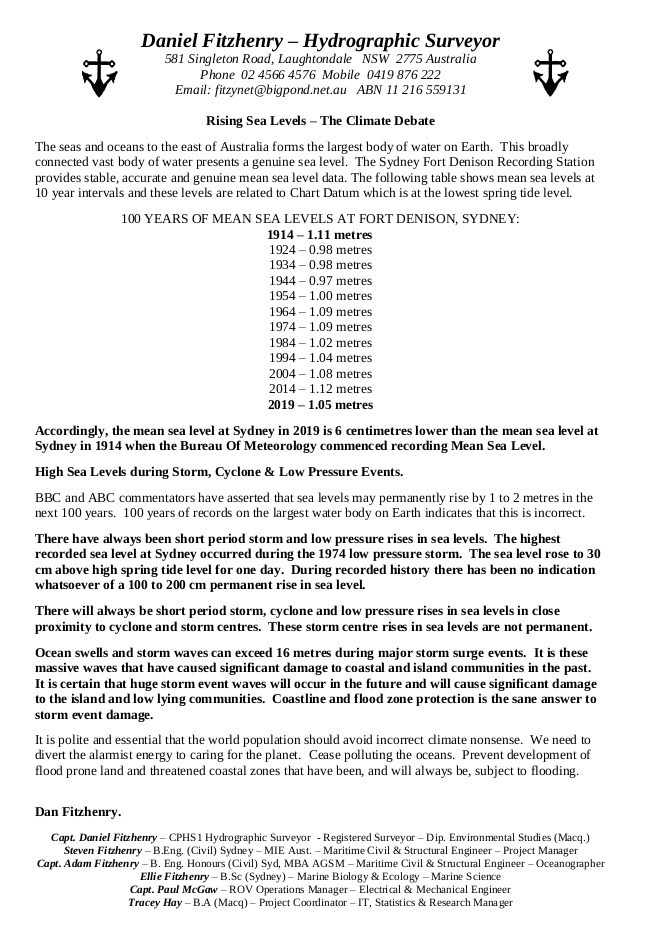
Sea Levels at Fort Denison - per Daniel Fitzhenry - Hydrographic Surveyor 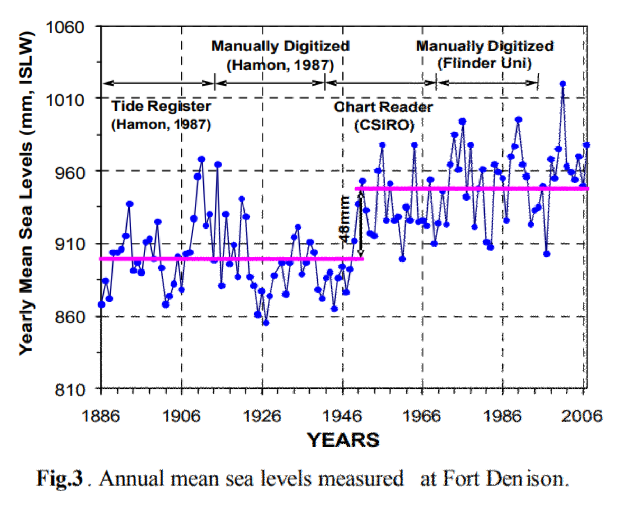
Sea Levels at Fort Denison-Official Record |
|||||||||||||||||||||||||||||||||||||||||
|
Shown, above, is a report regarding the sea levels recorded at Fort Denison in Sydney Harbour produced by Daniel Fitzhenry - Hydrographic Surveyor. This fits well with the official record, shown to the right of Fitzhenry's report. Note in the official record that the sea level is shown as having risen by 48mm around 1952. This occurred as a result of choosing a different system of measurement, using a different data point 48 mm lower than the previous one. The general trend shown in the official record is either stagnant or downwards. Both sources suggest that sea levels in Sydney Harbour are not rising and may be falling. (Note: There is the possibility the land in Sydney Harbour is rising because of the weight of buildings that have been constructed around the perimeter of the harbour in the last 200 years. What is certain is that the rate of rise of water level, if it is happening at all, is not significant. | |||||||||||||||||||||||||||||||||||||||||
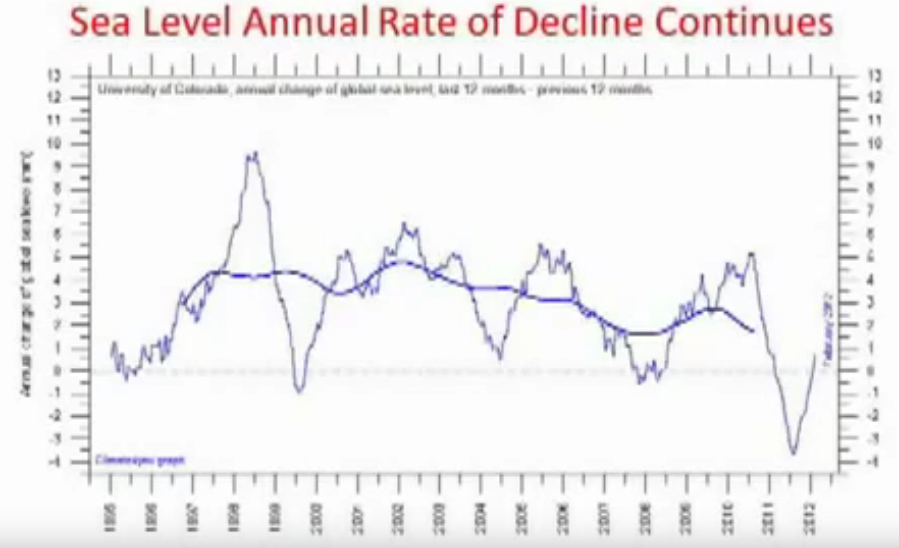
Sea Levels are dropping - John L Casey Presentation 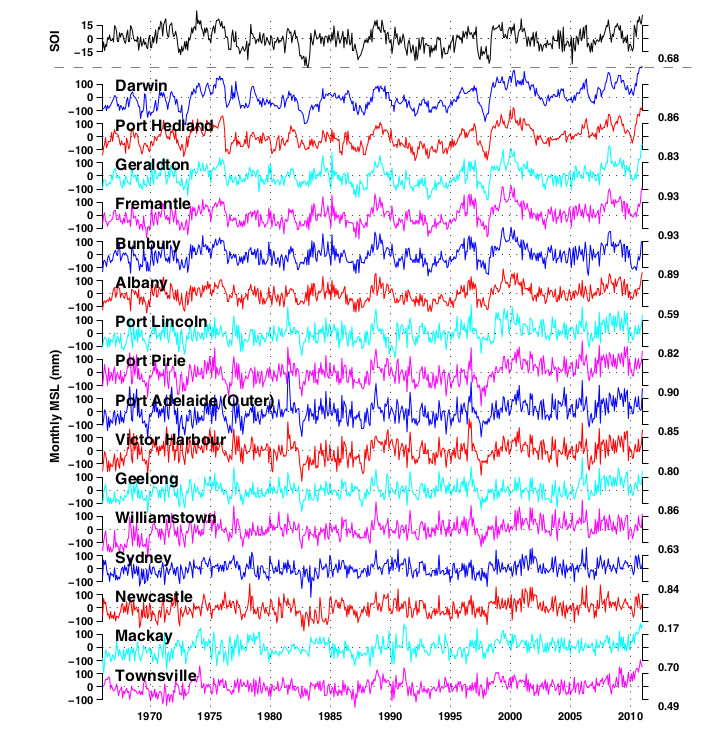
Tide Guage Data from Australian Coastal Tide Gauges Included here is a graph from a presentation by John L Casey, based on data from the University of Colorado, showing sea levels dropping. Here, too, are plots of the tide gauges around the Australian coastline. From these it can be seen there is no precipitate rise in sea level occurring. |
|||||||||||||||||||||||||||||||||||||||||
|
CO2 does not appreciably warm the atmosphere. 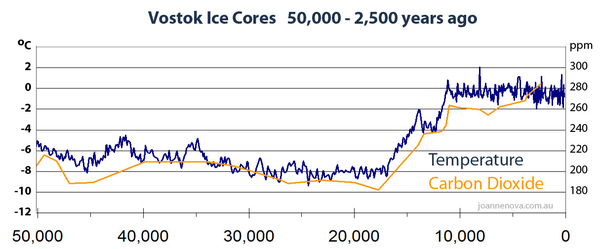
CO2 Concentration is caused by changes in Temperature, not the reverse Let's talk about the role of CO2 in terms of it causing atmospheric warming. Three sets of ice cores taken from Russia (Vostok), Antarctica and Alaska all show that CO2 follows temperature. It does not drive it. The matter of the findings regarding the Alaska samples is dealt with in detail in: Four Professors explain the Science of Climate Change to Canadian Senate Hearing 15th December, 2011Historical proxy data suggests that CO2 is a symptom not the cause of warming and its most likely primary source is the ocean.
Further to this, for the technically minded, here is a scientific paper which, using physics and a rigorous mathematical examination, calls into question the whole matter of whether CO2 causes any warming of the atmosphere at all. New Paper Uses Physics "Laws To Disassemble Greenhouse Theory. 3 Chemists Conclude CO2 Greenhouse Effect Is 'Unreal', Violates Laws Of Physics, Thermodynamics." |
|||||||||||||||||||||||||||||||||||||||||
|
Putting the Energy contained in, and the heating caused by, so-called Green House Gases into some perspective A standard atmosphere is defined as being 101,325 Newtons per square metre(where a Newton/square metre is called a Pascal). This is the equivalent of 10,332.275kilograms force exerted over a board that is 1 metre by 1 metre. That means that the weight of the air, on an area of 1 square metre, at sea level, is more than 10 tonnes. If you were to take the area of the earth (in square metres) and multply it by this weight, you get the weight of the atmosphere. For those interested it is approximately 5,269,460,000 tonnes. Some people mistakenly believe that "Green House Gases" somehow store huge amounts of energy that then cause the atmosphere to be warm. They don't. Their function is that they absorb infra-red radation and through conduction impart this energy to the surrounding air molecules. Let's deal firstly with the misconception man-made Green House Gases are a significant store of energy. Imagine for a moment that we could add up all the energy in CO2, Methane and Nitrous Oxide and add that energy to the Nitrogen, Oxygen, Argon and water vapour that makes up a "natural" atmosphere. How many degrees would it raise temperature of this latter group of gases that comprise the majority of the earth's atmosphere? We can roughly calculate this and, by doing so, put some things into perspective. The energy in CO2 and the other IR absorbing gases, in their present concentration, could never cause substantial warming of the atmosphere. Let's examine that.
Now imagine we take all of the energy that is in the CO2, Methane and Nitrous Oxide, found in 22.41litres of atmosphere at Standard Temperature and Pressure (STP); totalling 3.9590Joules and we heat the Nitrogen, Oxygen, Argon and Water Vapour component of that 22.41litres of atmosphere with this. In other words 21.8505x1.039xt + 6.7196x0.915xt + 0.0176x0.52xt + 0.15687x1.0xt = 3.9590Joules. From this we derive that t(the temperature rise) = 0.135605 degrees Centigrade. Of these gases, mankind accounts for somewhere between 3 and 5% (depending on the authority consulted). As a consequence, the temperature rise that would be achieved if we were to take all the energy from the gases attributed to mankind's industry, we would heat the atmosphere by something in the order of 0.067 degrees Centigrade as a maximum. This calculation has not taken into the account the huge mass of water that is held in clouds. If we were to do that, the temperature rise would be even less! It also does not take into account the fact that the specific heat of a gas changes with temperature and pressure; both of which reduce with altitude. Nevertheless, the proportionality of energy in each of the gases and water vapour remains roughly the same so this rough calculation does give a good indication of the trivial effect the energy contained, at any one time, in the so-called green house gases has on the other gases and water vapour that comprise earth's atmospere. This calculation is deliberately simplistic and rough... and, in itself, it is wrong. If only it were that simple! It is not. The fact is that CO2, Methane and Nitrous Oxide, absorb, on a continuous basis, Infrared radiation from both the sun and the earth and then re-radiate it. They also collide with other molecules of gas, many, many trillions of times a second, and thereby transmit their heat to these molecules by conduction. In doing this, they are analagous to a heating element in a jug with the infrared being the electricity that heats up the element which, in this case, is a group of gases that are referred to as "Green House Gases"(GHG). This applies not only to radiation entering the earth's atmosphere but also the radiation, being emitted by an earth warmed by sunlight, trying to exit the earth's atmosphere. These gases and water vapour reduce the amount of radiation striking the earth's surface and it has been posited by some that these gases slow down the exit of radiation going upwards into space. But the fact is, the sum total of the radiant energy impacting earth has come from the sun. It is not magically created by these so-called green house gases. if the gases had not intercepted some of the sun's radiation on its way to earth, this radiation would have heated up the earth's surface which would then have conducted that heat to the molecules of gas in intimate contact with it. By intercepting radiation before it strikes the earth's surface, IR absorbing gases and vapour reduce the extremes of temperature experienced on the earth's surface. Consider for a moment the temperatures being experienced on the moon where there is virtually no atmosphere. When sunlight hits the moon's surface, the temperature can reach 260 degrees Fahrenheit (127 degrees Celsius). When the sun goes down, the radiation from the moon's warm surface rapidly exits into space and temperatures can dip to minus 280 F (minus 173 C). This is the key role that the earth's atmosphere plays. It makes temperatures on earth more temperate. When considered holistically, IR absorbing gases and vapour dissipate the heat throughout the atmosphere, causing convection currents which move energy far more positively upwards than does radiation. Along with the other gases that comprise the earth's atmosphere, these IR absorbing gases and vapour assist in the controlled dissipation of the sun's radiant energy back into space. An argument can be made that Carbon Dioxide, in the lower atmosphere, actually helps with cooling, not warming. See Cooling of Atmosphere Due to CO2 Emission
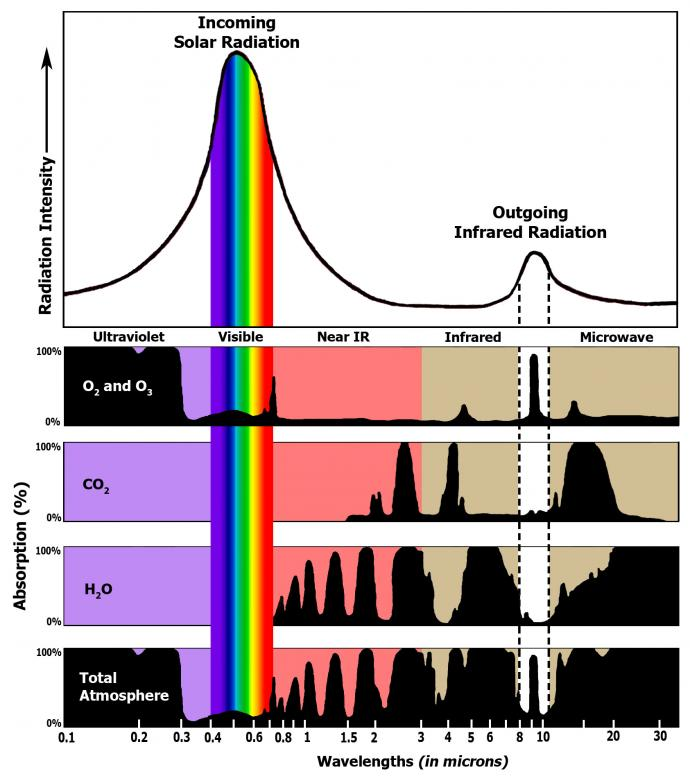
RadiationAbsorptionSpectrum This graphic illustrates the fact that water vapour plays a major role in absorbing infrared radiation. Note also that CO2 absorbs very little of the IR spectrum and therefore absorbs comparatively little energy when compared to water vapour. Indeed, if you were to extract all of the CO2, Methane and Nitrous Oxide from the atmosphere, the water vapour would absorb and re-radiate all of the radiation that these gases were previously absorbing and emitting before their removal. Adding further to the trivial role of CO2 is the fact that air, when it comes into contact with a warm surface, such as a sunlit earth, rapidly extracts the heat energy from that surface by conduction and then convects upwards (not unlike the way the element in an oven heats the air for the purposes of baking food). This not only helps to dissipate heat energy throughout all molecules comprising the atmosphere but it also gives rise to winds which further transport the energy stored in all molecules to higher altitudes where the energy rapidly dissipates in the form of electromagnetic radiation into space. For a more technically based dissertation on this, I recommend you go to: Chilingar Paper - Effect of CO2 in the lower Troposphere; CO2 does not appreciably cause warming. This states, "The proponents of this [AGW] theory take into consideration only one component of heat transfer in atmosphere, i.e., radiation. Yet, in the dense Earth's troposphere with the pressure greater than 0:2atm, the heat from the Earth's surface is mostly transferred by convection(Sorokhtin, 2001a). According to our estimates, convection accounts for 67%, water vapor condensation in troposphere accounts for 25%, and radiation accounts for about 8% of the total heat transfer from the Earth's surface to troposphere. Thus, convection is the dominant process of heat transfer in troposphere, and all the theories of Earth's atmospheric heating (or cooling) first of all must consider this process of heat (energy) - mass redistribution in atmosphere (Sorokhtin, 2001a, 2001b; Khilyuk and Chilingar,2003, 2004)." There is one further point to be made regarding the effect that CO2 has on the temperature of the earth's atmosphere. The concentration of CO2 in the earth's atmosphere is now at approximately 400 parts per million. Professor Will Happer makes the valid point that this concentration is such that all of the energy extant in the narrow bands of the IR spectrum that CO2 can absorb is presently being absorbed. Adding more CO2 will not appreciably add to this absorption. |
|||||||||||||||||||||||||||||||||||||||||
|
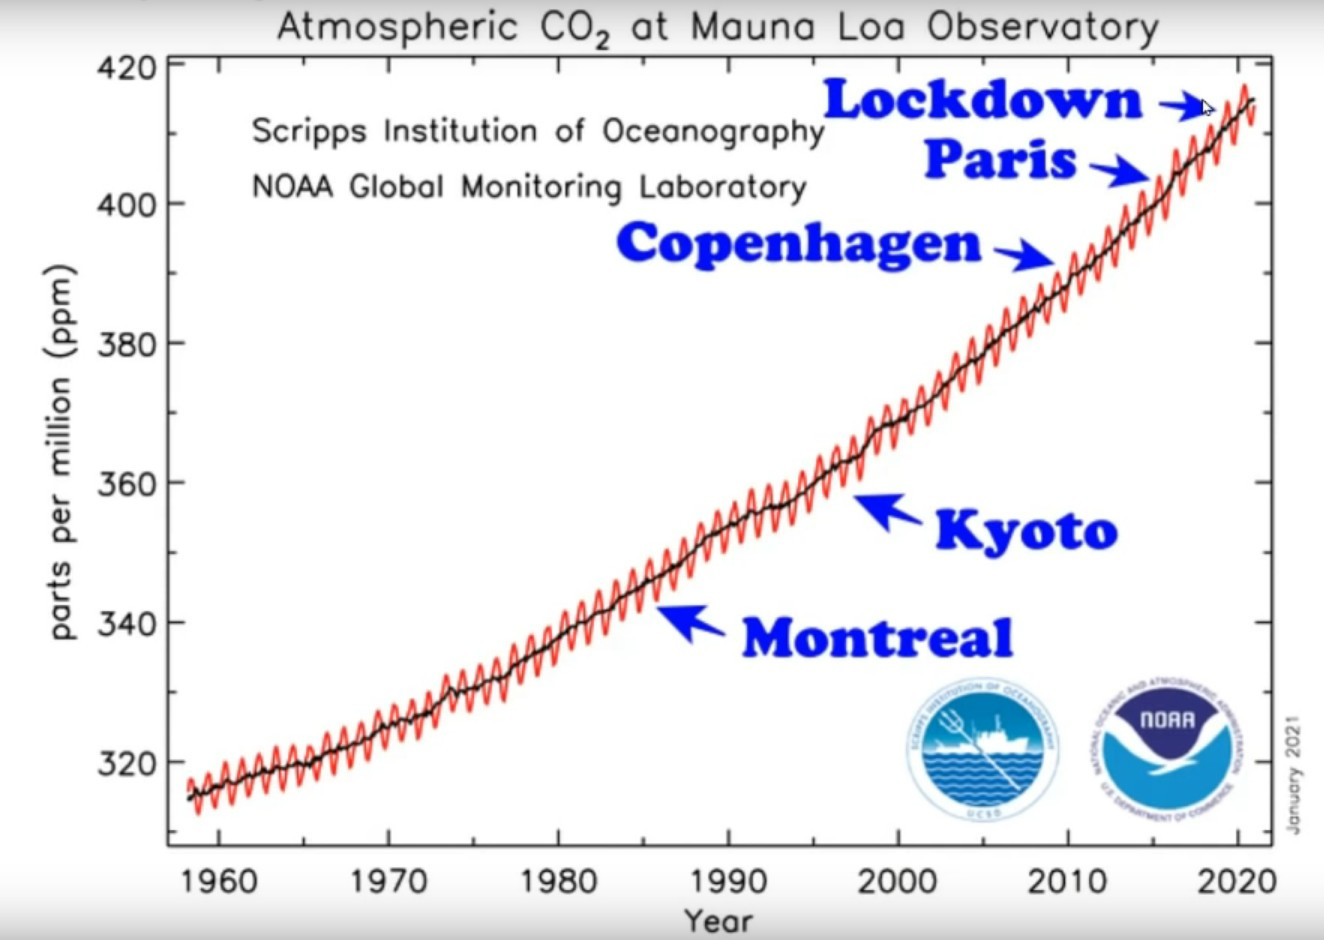
Major Celestial Cycles and their Effect Finally, before moving on, here is a graph that shows the rate of rise of CO2 concentration in the atmosphere continues, unaffected, by policies, treaties and human activity. Notably, during the significant reduction in human industrial activity due to COVID-19 lockdown in 2020, there has been no appreciable change in the rate of rise of CO2 concentration in the earth's atmosphere. |
|||||||||||||||||||||||||||||||||||||||||
|
The Celestial Cycles that affect Earth's Climate
Major Celestial Cycles and their Effect To gain an idea as to how these cycles can sometimes reinforce each other and, at other times, counteract each other, you should look at the following video: Illustration of 15 billiard balls oscillating at different frequencies. I recommend readers take the time to watch Robert's series of videos on this subject. They are most informative. Here is a list for your convenience: Climate Science 1; There is No "Greenhouse Effect" Climate Science 2; There is No "Extra Warming" to Explain. Climate Science 3; There is No "Greenhouse Effect" on Venus Either. Climate Science 4; The Ice CO2 Record is "Probably Wrong" Too. Climate Science 5; The IPCC's Forcing Estimates are Wrong Too. |
|||||||||||||||||||||||||||||||||||||||||
|
The Connolly & Connolly Research Papers into the Lapse Rate - Game Changing Proof CO2 has no Extraordinary Effect on Atmospheric Temperature - Finally! Borrowing heavily from the website Watts Up With That? . In 2014, Dr. Michael Connolly and Dr. Ronan Connolly posted three important, non-peer reviewed papers on atmospheric physics on their web site These papers can be accessed online. The papers are difficult to understand as they cover several fields of study and are very long. But, they present new data and a novel interpretation of energy flow in the atmosphere that should be seriously considered in the climate change debate. By studying weather balloon data around the world Connolly and Connolly show that the temperature profile of the atmosphere to the stratosphere can be completely explained using the gas laws, humidity and phase changes. The atmospheric temperature profile does not appear to be influenced, to any measurable extent, by infrared active gases like carbon dioxide." You may also download from my website this presentation in PDF format which was developed and presented by Dr Michael Connolly and Dr Ronan Connolly at a convention in Tucson, Arizona, USA in July of 2019. It is an excellent and most interesting and informative presentation consisting of 106 slides. Put simply, CO2, Methane and Nitrous Oxide cause no greater warming of the atmosphere than any of the other gases and vapours that comprise it! This research by the Connollys is, in my opinion, extremely signficant and deserves detailed study. The approach they have taken is, to me, very clever. It has great promise in giving mankind a far better understanding of the physics and thermodynamics related to how the earth's atmosphere behaves under the influence of the sun and the gases, particularly those that absorb infra-red radiation, that comprise it. The Connollys' home page may be found at Global Warming Solved . I strongly recommend the work of the Connollys. Readers might also like to view summaries of the Connollys' peer-reviewed papers at the Center for Environmental Research and Earth Sciences website. I commend them to anyone with an interest in this subject. |
|||||||||||||||||||||||||||||||||||||||||
|
Tony Heller At the beginning of this web page I provided links to video presentations by Tony Heller. To learn about Tony go to this link . Tony is an exceptional person on many levels. Firstly he holds degrees in Geology and in Electrical Engineering. He also has shown himself to be a gifted technical data auditor with strong capabilities in the area of software development and the use of web media for presentation of information. He is a tireless seeker of the truth. I have performed random checks on his work and I can't fault it. If you want to learn the truth about this whole subject of climate change and anthropogenic global warming, I believe you couldn't find a better source of factual information. I have made a modest donation of money to assist Tony in his efforts and I strongly recommend readers of this page do so too. I believe this world owes Tony a huge debt of gratitude for what he has so far done and what he continues to do in exposing the misinformation, exaggeration and deliberate fraud surrounding this whole matter. In Australia's case, the pursuit of low emissions has cost this country many billions of dollars. The introduction of solar and wind to the national grid has more than doubled the cost of energy in this country and threatens the viability of all industrial activity. This issue has the potential to ruin Australia's economy and impact severely on the most vulnerable in our community. Australia is not alone. Germany is faced with similar serious issues. All to fix a problem that doesn't exist! |
|||||||||||||||||||||||||||||||||||||||||
|
Increased CO2 is good for planet earth! |
|||||||||||||||||||||||||||||||||||||||||
Increased CO2 has increased crop yields 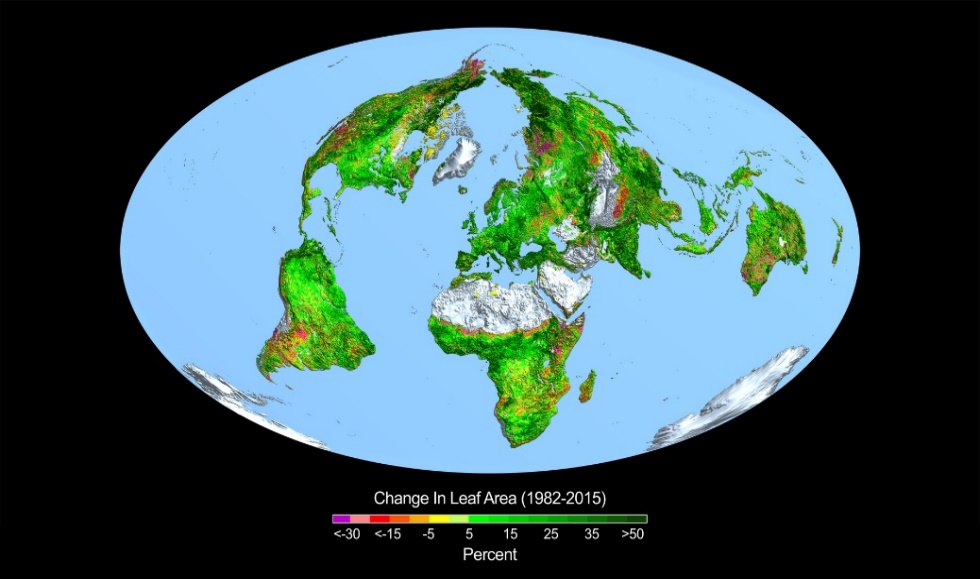
Increased CO2 'Greened The Earth' |
|||||||||||||||||||||||||||||||||||||||||
|
See Professor Dr David Legates The recent increased CO2 concentration in the atmosphere has caused deserts to recede and crops to do much better than anticipated. CO2 is good for both land and sea flora and fauna. NASA reported that the increased area of greening on land was equal to approximately the area of two continental USAs. This is an increase of around 6% in the capacity of land based plants to consume CO2. Mankind's contribution of CO2 to the atmosphere is estimated to be around 3 -> 4% yet, despite an increase of 6% CO2 absorbing capacity, the biosphere still has an increasing concentration of CO2. This increase cannot therefore be primarily the result of human CO2 emissions. |
|||||||||||||||||||||||||||||||||||||||||
|
The CO2 is coming from the oceans. The CO2 is coming from somewhere else; most likely from the oceans according to Professor Dr. Don Easterbrook. For further information see: Professor Dr. Don Easterbrook's US Senate Committee testimony regarding the fabrication of carbon based climate change. (Published on Nov 13, 2015). CO2 is good for marine life also. The oceans are alkaline, not acidic. (Their pH is a little greater than 8). When CO2 dissolves in sea water it reacts with mineral ions to form bicarbonates which are mildly alkaline, not acidic. These bicarbonates are essential for the development of the exoskeletons of all shell-fish and the polyps that form coral reefs. CO2 could never cause the oceans to become acidic. How could so-called scientists get such basic chemistry so very wrong? Extreme Weather Events have become less over the last 120 years. 
Declining Extreme Weather Events. Professor Easterbrook provides, during that testimony, to the US Senate a wide range of statistical data that causes one to seriously doubt all that has been asserted by those who believe that the world is heading for a catastrophe should mankind's CO2 emissions not be curbed. Of particular insterest is the fact that severe weather events have actually decreased, not increased over the century. The same applies to droughts. They have become less, not more. |
|||||||||||||||||||||||||||||||||||||||||
|
The Sun is the primary driver of climate on earth. 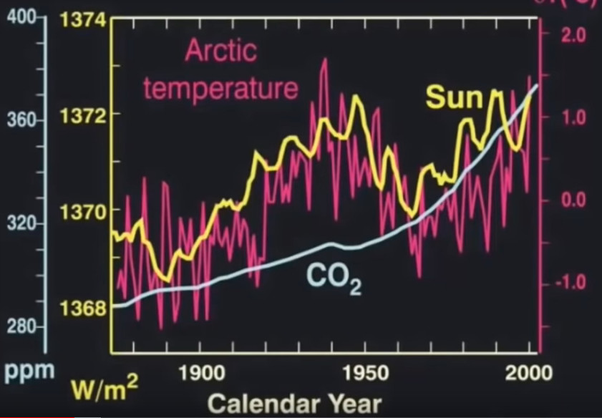
Climate is mainly affected by the sun. The sun drives the climate, NOT CO2! Here is a graph (Professor Ross McKitrick presentation to Canadian Senate hearing on Climate Change, 15th December, 2011) that shows the relationship between solar radiance and earth's temperature. This suggests that the earth's climate is primarily driven by the sun and the earth's attitude and position relative to it in accordance with the Milankovitch Cycles (See The Milankovitch Cycle.) This graph shows CO2 is a response of recent increased solar irradiance. Note also that climate on earth is affected by the celestial cycles listed above. Within the sun there are also movements of plasma that change the strength of the sun's magnetic field. When the strength of the magnetic field drops, cosmic rays can more easily enter the solar system and therefore there is a higher flux of cosmic rays striking earth's atmosphere which, in turn, results in inceased clouds in earth's atmosphere. These clouds reflect the sun's radiation making the earth's climate cooler. This will be dealt with in greater detail later. "Winter is Coming!" |
|||||||||||||||||||||||||||||||||||||||||
|
Low CO2 levels may have helped to end Ice Ages. The reverse is also the case. When insolation decreased, CO2 levels fell, ice caps formed and these reflected sunlight back into space locking the earth into an ice age. When CO2 fell below 200 parts per million because of that drop in temperature, plant life failed and deserts formed. When that happened, the earth was beset with huge dust storms. This dust settled on the ice and snow and inhibited its ability to reflect sunlight back into space. This caused the melting of ice caps and glaciers, thereby ending the ice age which, in turn, increased atmospheric CO2 concentration, leading again to rich plant life. Bizarrely, It was a lack of CO2 that caused warming, not its abundance! (See "The Holy Grail? A Remarkable Discovery In Climate Science", by Gordon Fulks, published December 11, 2018.) High concentrations of CO2 are good for the planet. Not the reverse. The Onset of a Grand Solar Minimum - Winter is coming! 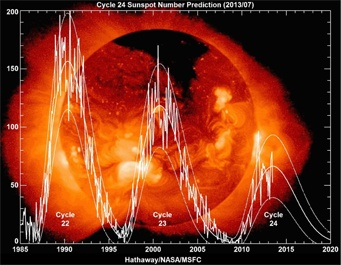
The Solar Cycles are declining. A phenomenon called "The Grand Solar Minimum" has begun. The sun operates in cycles of around 11 years. As can be seen from the illustration, the strength of these cycles is decreasing. Added to that, there exists within the sun magnetic disturbances that cause sunspots. These disturbances affect the level of output of solar radiation by the sun. Professor of Mathematics at Northumbria University, UK, Dr Valentina Zharkova's research team have now successfully modelled the behaviour of the magnetic disturbances of the sun. |
|||||||||||||||||||||||||||||||||||||||||
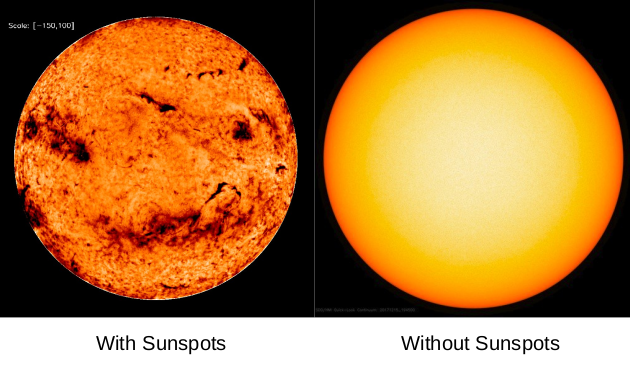
The Sun with and without Sunspots. |
|||||||||||||||||||||||||||||||||||||||||
|
Clouds can cause cooling. 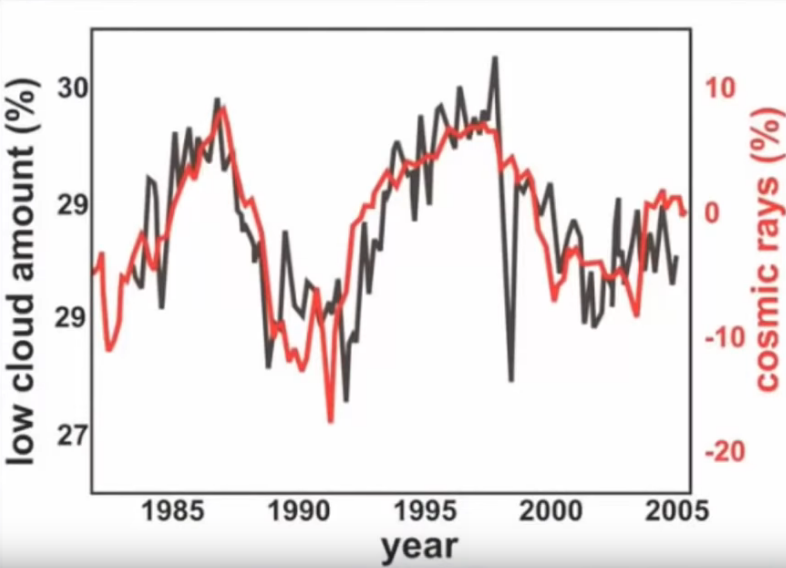
Cosmic Rays may cause increased cloudiness in the atmosphere and hence cooling of the earth. A major contributor to this cooling could be the formation of clouds resulting from increased cosmic rays striking the earth because of the sun's weakened magnetic field. These clouds will reflect the sun's radiation back into space. |
|||||||||||||||||||||||||||||||||||||||||
|
The Earth's Magnetic Field is Weakening. Added to this, the earth's magnetic field appears to be weakening at a rate of around 5% per decade though there is some controversy as to whether this figure is a misinterpretation of data derived from SWARM satellites. If the rate of decrease is accurate, then it is around 10 times faster than it was in the 19->20th century and that is cause for concern. Should this decrease continue, earth's protection against cosmic rays will be depleted to the extent that life on earth could be threatened. Some scientists have opined that some of the mass extinctions experienced on earth have resulted from the decrements of the earth's magnetic field during the time when the poles "flip". Others say, "No". Nevertheless, the reduced magnetic field of the earth, coupled with the reduced magnetic field of the sun will result in additional cloud formation which will result in additional cooling. |
|||||||||||||||||||||||||||||||||||||||||
|
Conclusion/Summary A summary of the conclusions of this paper is as follows:
I have produced a presentation that may be useful for people wishing to speak on this subject in Microsoft Powerpoint Format and in LibreOffice ODP format. Notes are embedded within this presentation. To see the notes and the presentation in one convenient document, click on the here or below. These are provided here is you wish to download them: |